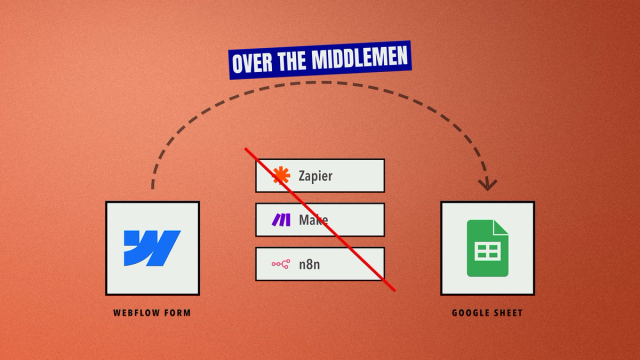
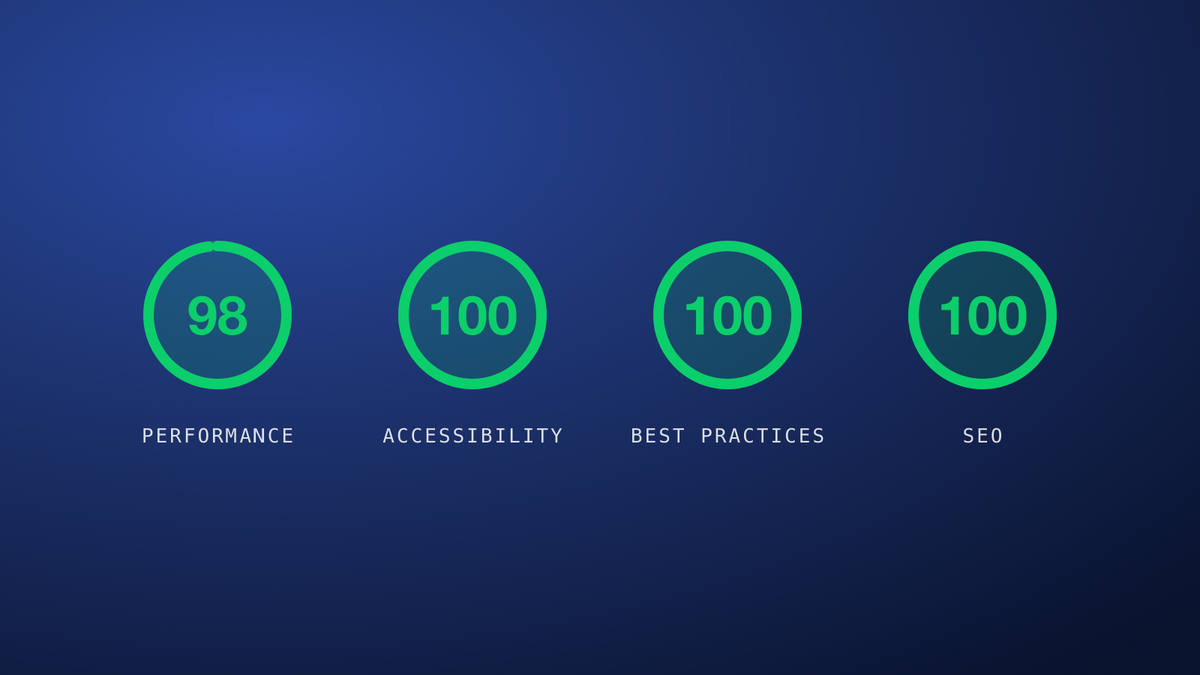
The sites I build regularly score 95 or higher for Performance on Google's PageSpeed Insights, with Accessibility and SEO at or near 100. Most run on Webflow. Others I build with an agentic workflow and host on my own stack. Here's what the scores mean, and the habits that produce them.
A few recent results
Here are some reports from sites I've delivered, straight from PageSpeed Insights. Nothing was tuned for the test. These are live sites as clients use them, and they're a sample, not the full list.
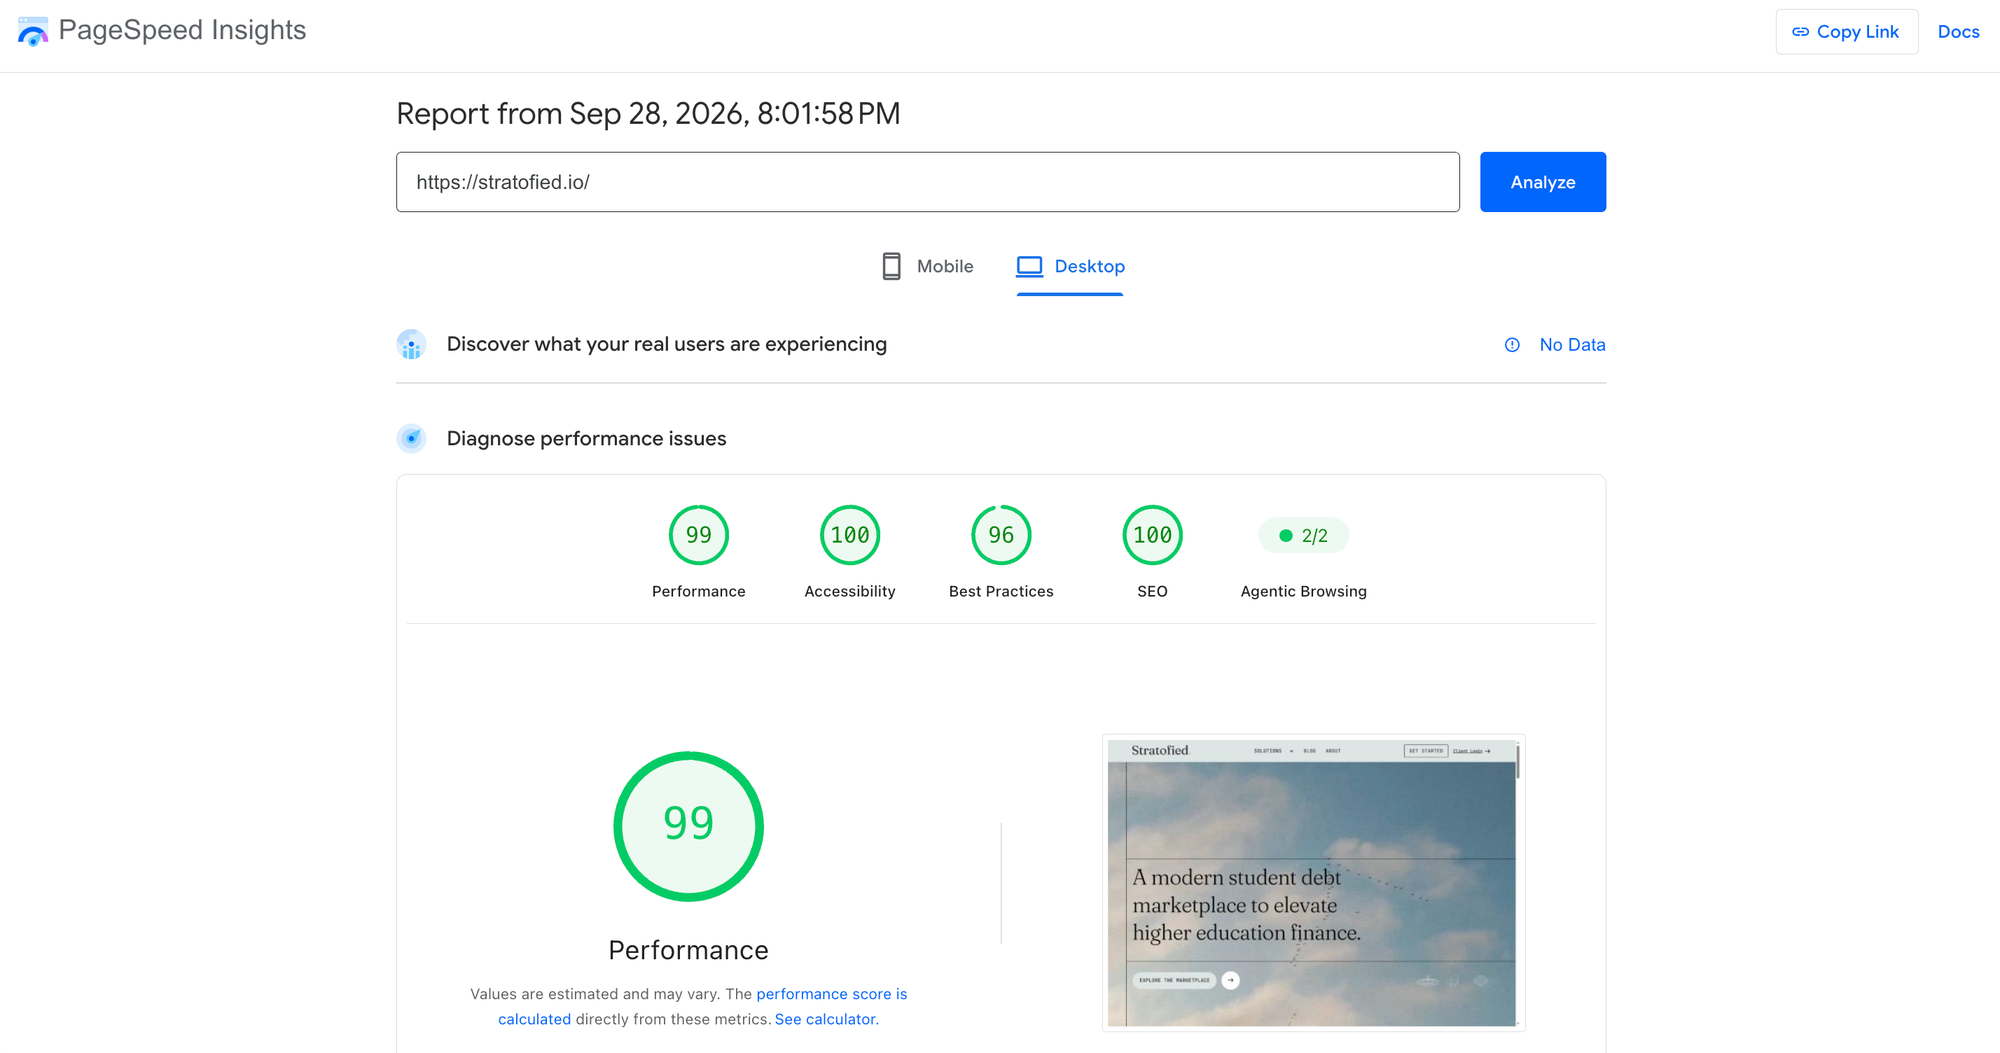
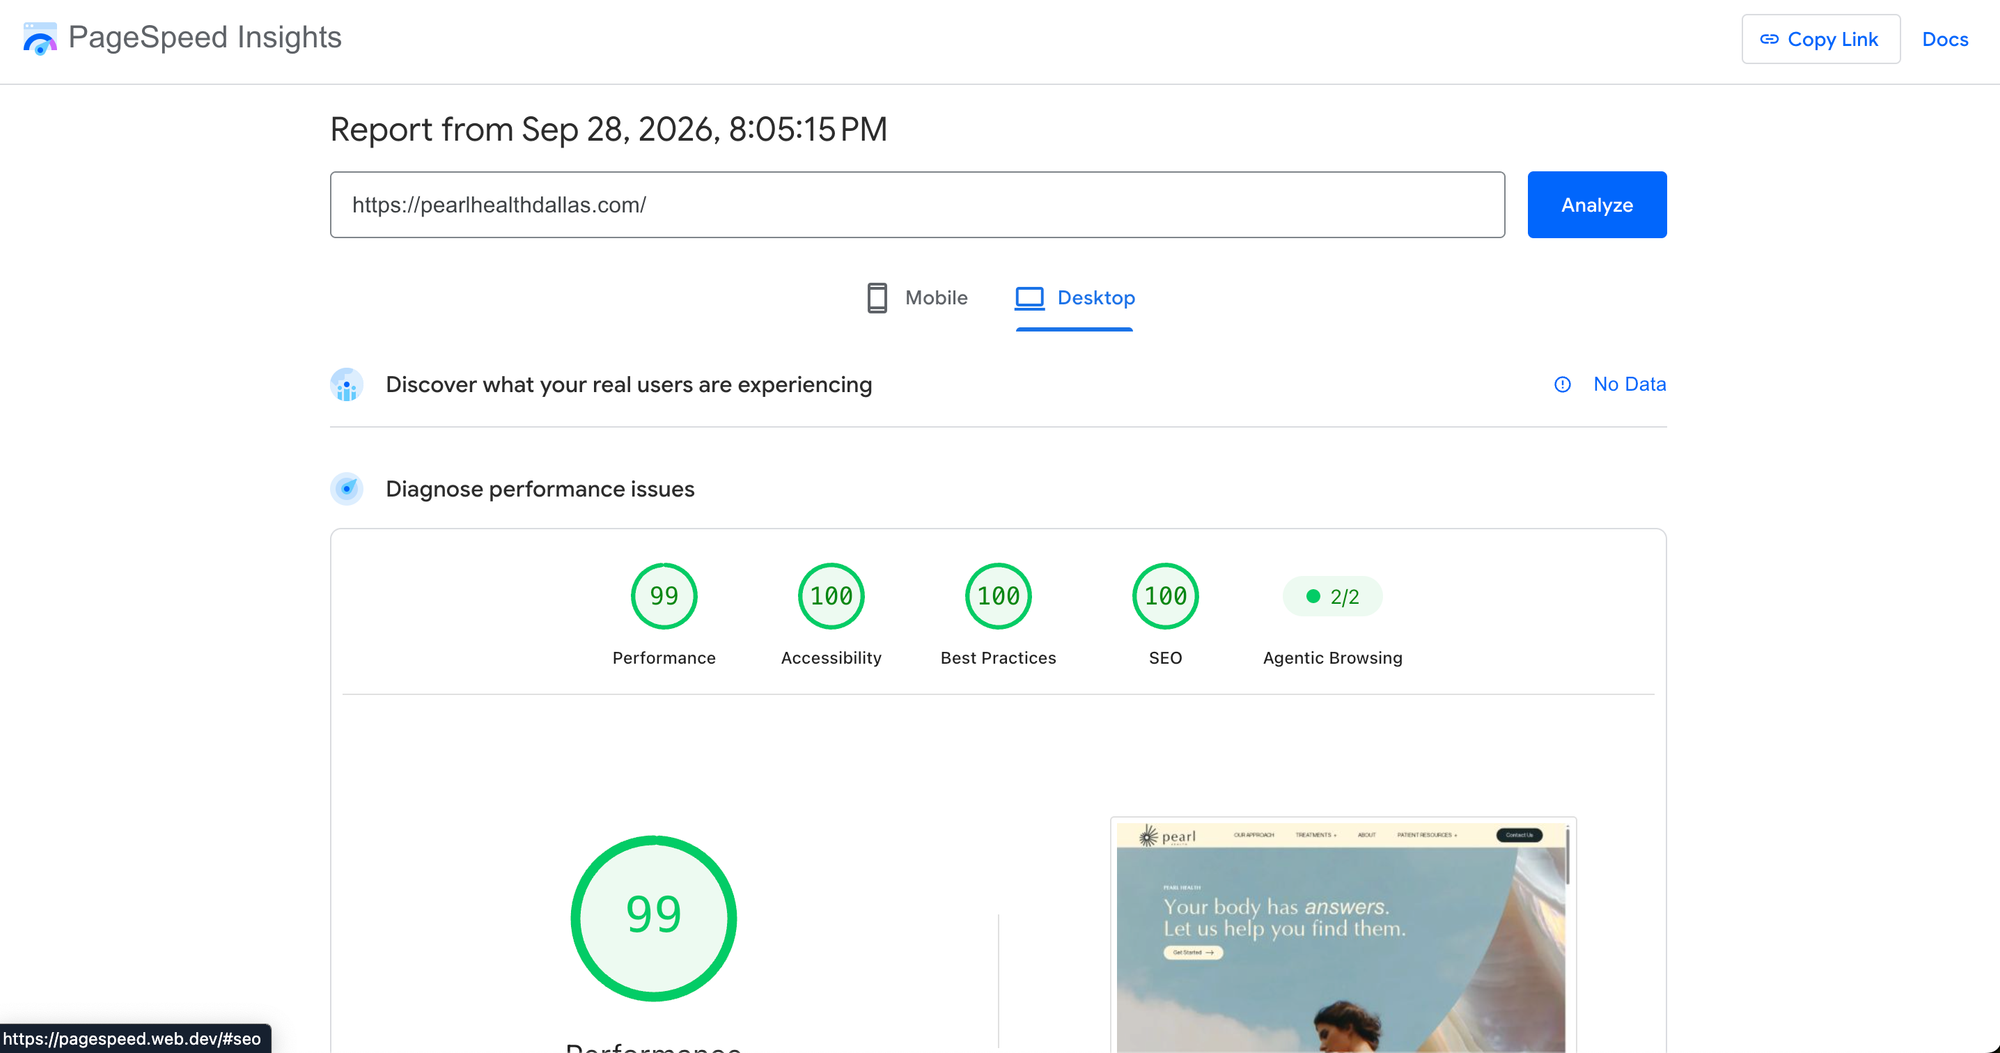
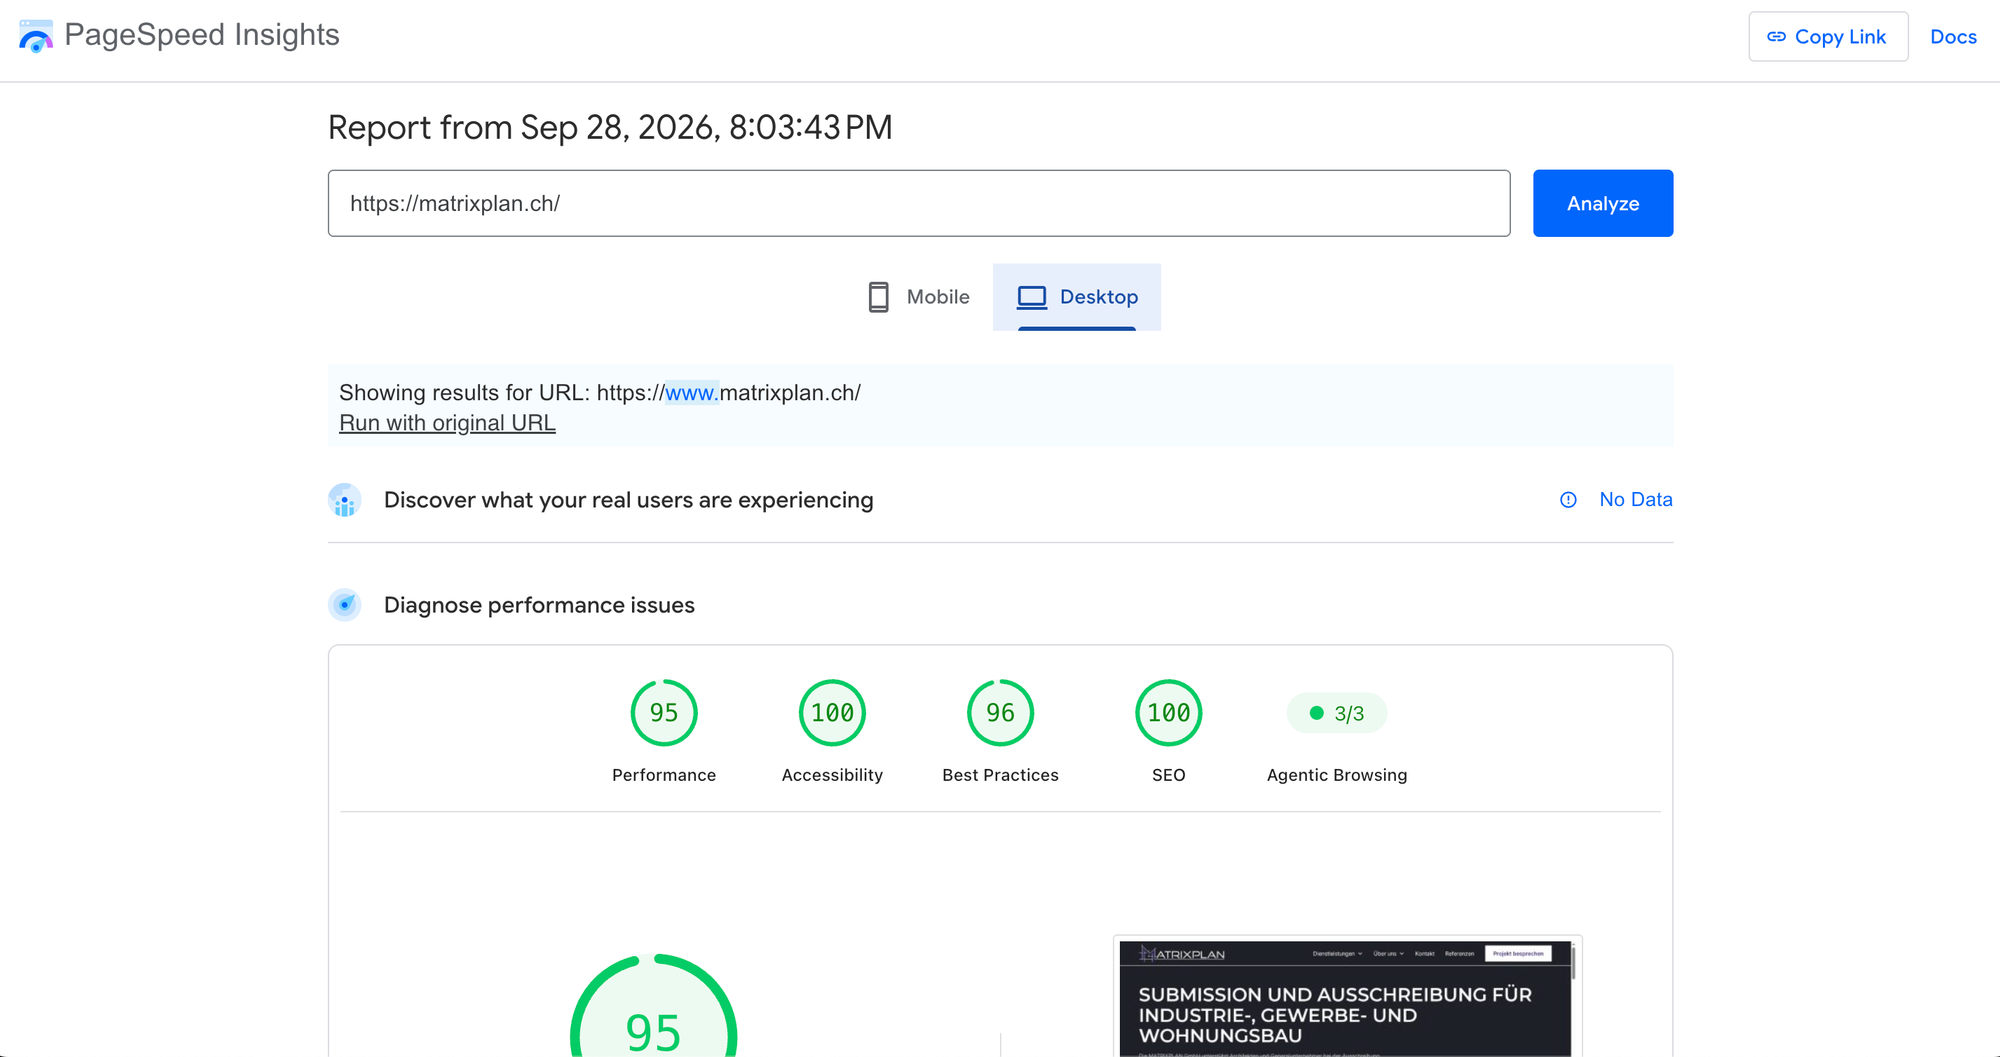
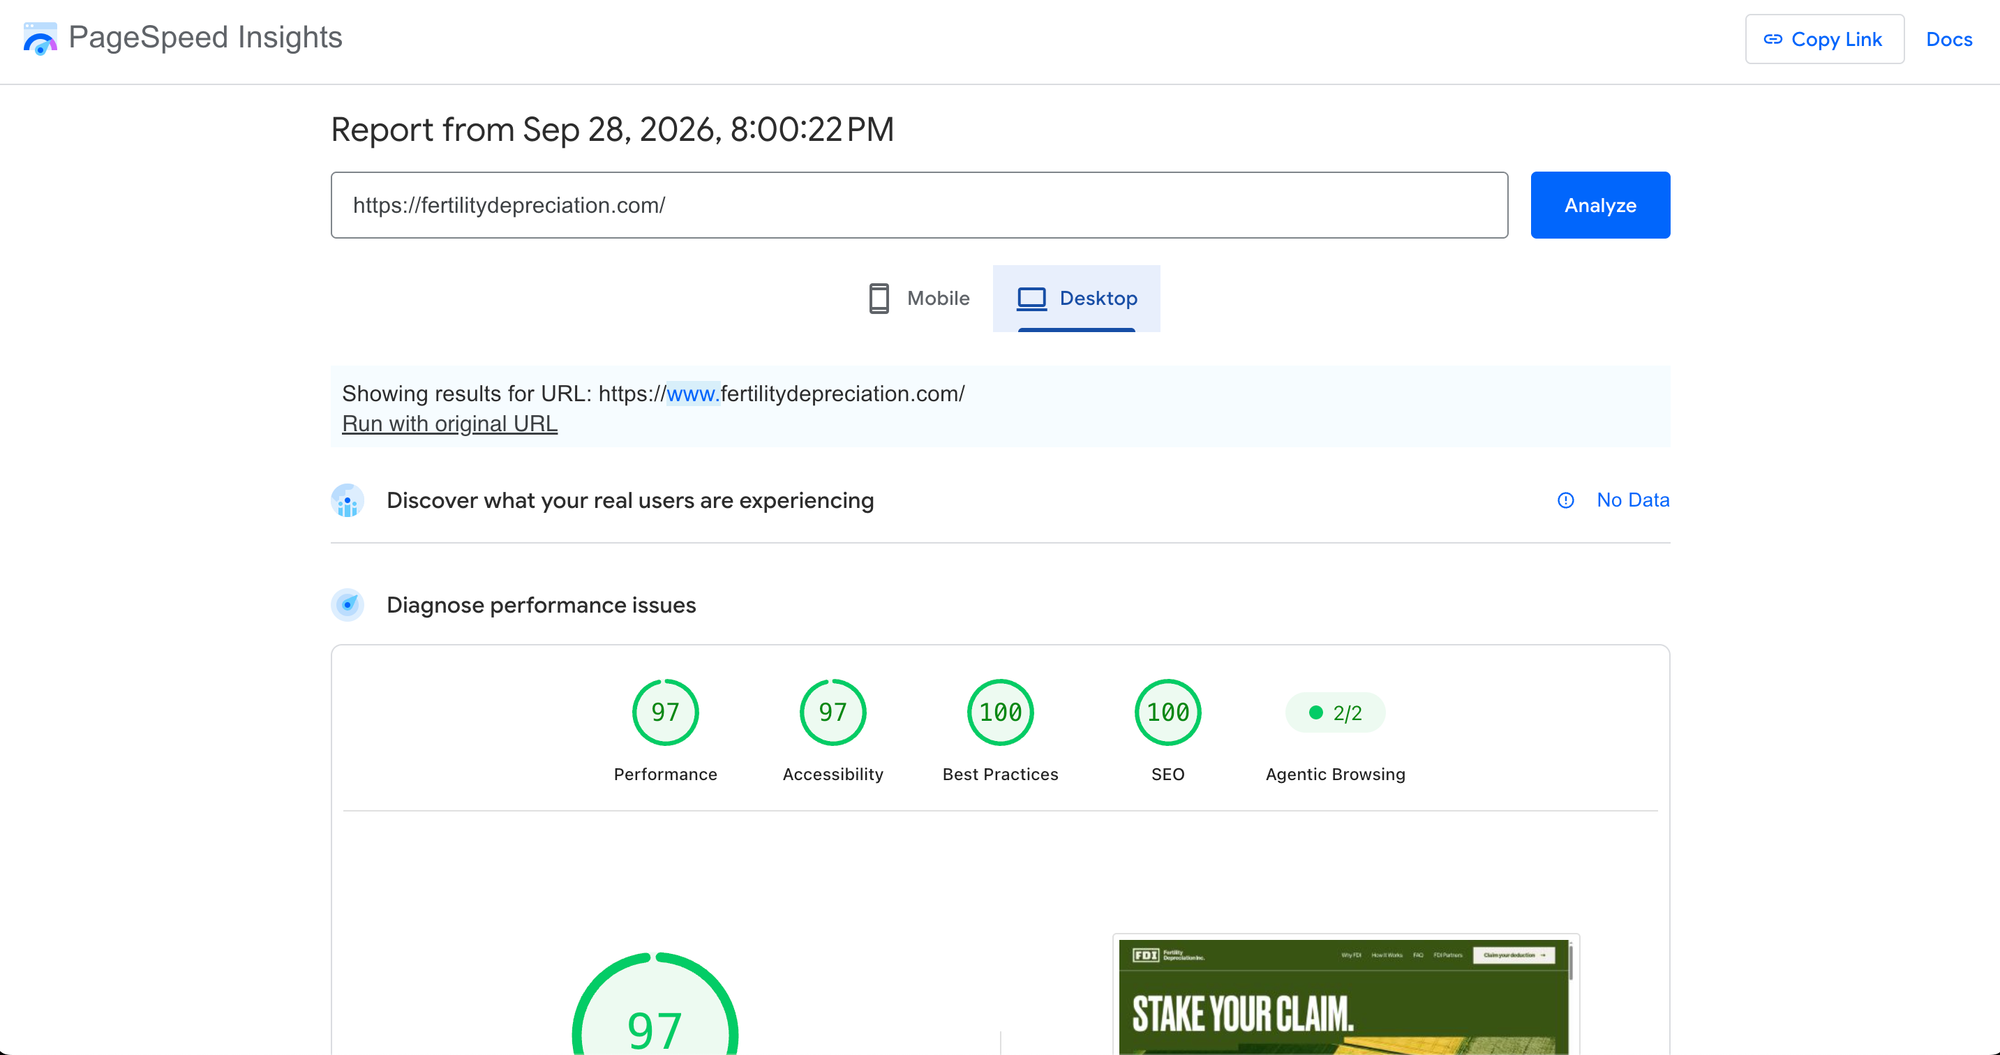
Google counts 90 and above as good. Green circles across all four categories is the standard I build to.
What the numbers measure (without the jargon)
PageSpeed Insights loads your page in a controlled test and grades it from 0 to 100 in four areas.
- Performance: how fast the page shows up and becomes usable.
- Accessibility: whether people using screen readers, keyboards or low-contrast screens can use it.
- Best Practices: security and code hygiene. HTTPS, no browser errors, correctly sized images.
- SEO: whether search engines can read and index the page.
Performance is the hard one. It's built from five measurements:
| Measurement | What it asks | Share of the score |
|---|---|---|
| Total Blocking Time | How long is the page frozen by scripts? | 30% |
| Largest Contentful Paint | When does the main content appear? | 25% |
| Cumulative Layout Shift | Does the layout jump around while loading? | 25% |
| First Contentful Paint | When does anything appear? | 10% |
| Speed Index | How quickly does the visible part fill in? | 10% |
Three of those five decide 80% of the score. Scripts, the hero image, and layout stability. That's where I spend my time.
What I do on every build
None of this is a trick. It's a checklist I run before a site goes live, whatever the platform.
The hero image gets special treatment. It's usually the largest thing on screen, so it decides Largest Contentful Paint. I export it as WebP in several widths, so a phone downloads a 400 px file and not a 2,000 px one. Then I tell the browser to fetch it first with fetchpriority="high". One attribute, 30 seconds.
Everything below the fold loads lazily. Images the visitor hasn't scrolled to yet don't compete with the ones they're looking at.
Every image has its dimensions set. When the browser knows the size in advance, it reserves the space. Nothing jumps when the image arrives. That's most of Cumulative Layout Shift solved.
Scripts have to earn their place. Every chat widget, tracker and animation library adds blocking time. I load what the page needs, defer the rest, and push analytics until after the page is usable.
Fonts are kept small. Two families at most, only the weights in use, and text stays visible while the font loads.
Semantic HTML from the start. Real headings in order, real buttons, alt text, labels on forms, enough colour contrast. That's why Accessibility and SEO land at 100 without a separate project to fix them later.
I test before handover, not after a complaint. PageSpeed is part of my launch checklist, on both the Mobile and Desktop tabs.
Webflow or my own stack: the score doesn't care
Most of my client work is on Webflow. It gives you a good starting point: global hosting, responsive image variants, minified code. A careful Webflow build can score in the high 90s, and mine do.
The more interesting part is the other half of my work. I now build some sites with an agentic workflow and host them myself, on my own stack. I expected to pay for that freedom with a lower score. The opposite happened.
The reasons are simple once you see them:
- I ship only what the page uses. No platform runtime, no unused CSS, no script I didn't choose.
- Pages are pre-built. The visitor gets finished HTML from a server close to them, not a page assembled on request.
- I control every image and every header. Formats, sizes, caching and load order are my decisions, not a platform default.
- The agent does the tedious part. Generating image variants, checking alt text and running audits on every change is exactly the work people skip under deadline. An agent doesn't skip it.
So the platform isn't what sets the score. The care in the build is. Webflow makes a good score easy to reach. My own stack removes the ceiling.
Be honest about the limits
A green score is good news. It isn't the whole story, and I'd rather tell you that myself.
- Desktop and mobile are different tests. The Mobile tab simulates a slower phone on a slower connection, so mobile numbers are lower for almost every site.
- It's a lab test. Newer and smaller sites often show "No Data" for real users, because Google needs enough Chrome traffic before it reports field data. As traffic grows, real-user numbers are the ones to watch.
- Scores move between runs. A point or two up or down is normal. Run the test three times and look at the pattern.
- Third-party tools cost points. If a client needs a chat widget, a booking tool or a marketing tracker, the score will dip. That's a business decision, and sometimes the right one.
- A score isn't the goal. The goal is a visitor who stays. A fast site with a confusing message still loses.
The takeaway
A slow site loses people before they've read a word. A fast one is rarely an accident. It comes from a short list of habits applied on every build, on Webflow or anywhere else.
Paste your own URL into PageSpeed Insights and look at the four circles. If they aren't green, the fix is usually smaller than you'd think.
Want me to look at your site's score and tell you what's holding it back? Get in touch.