Almost every business you build websites for runs on a spreadsheet somewhere. Sales figures, project hours, bookings, invoices, stock levels. The data is there and it's up to date, because people update it every day.
What's missing is a good way to look at it. Sharing the spreadsheet means everyone sees every tab, every formula and every half-finished note. Building a "real" dashboard usually means a BI tool licence, a data migration and a project nobody budgeted for.
There's a middle path, and it fits naturally into what web agencies already do: a private dashboard app on the client's own domain, reading live from their spreadsheet, visible only to the people they invite.
The idea in one picture
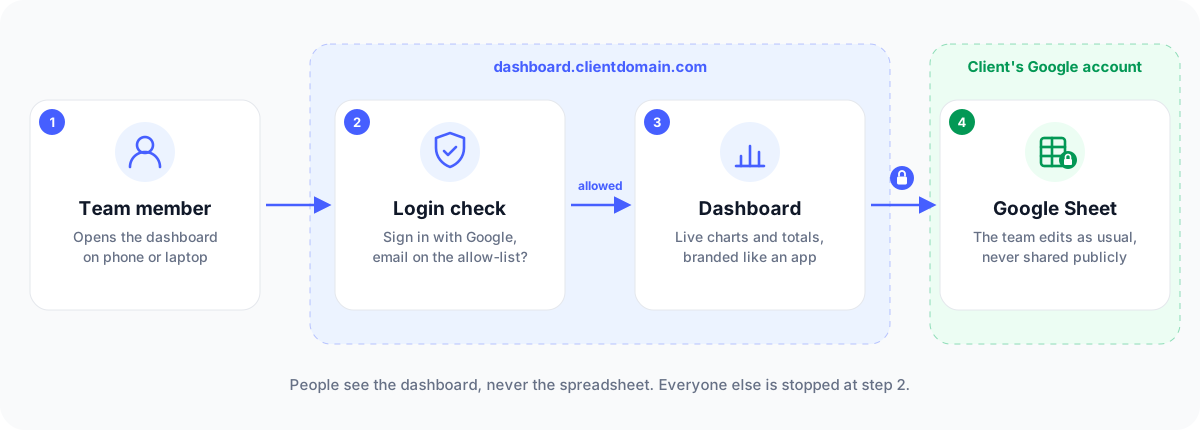
- The team keeps editing the spreadsheet exactly as before.
- Invited people open dashboard.clientdomain.com and sign in with their Google account.
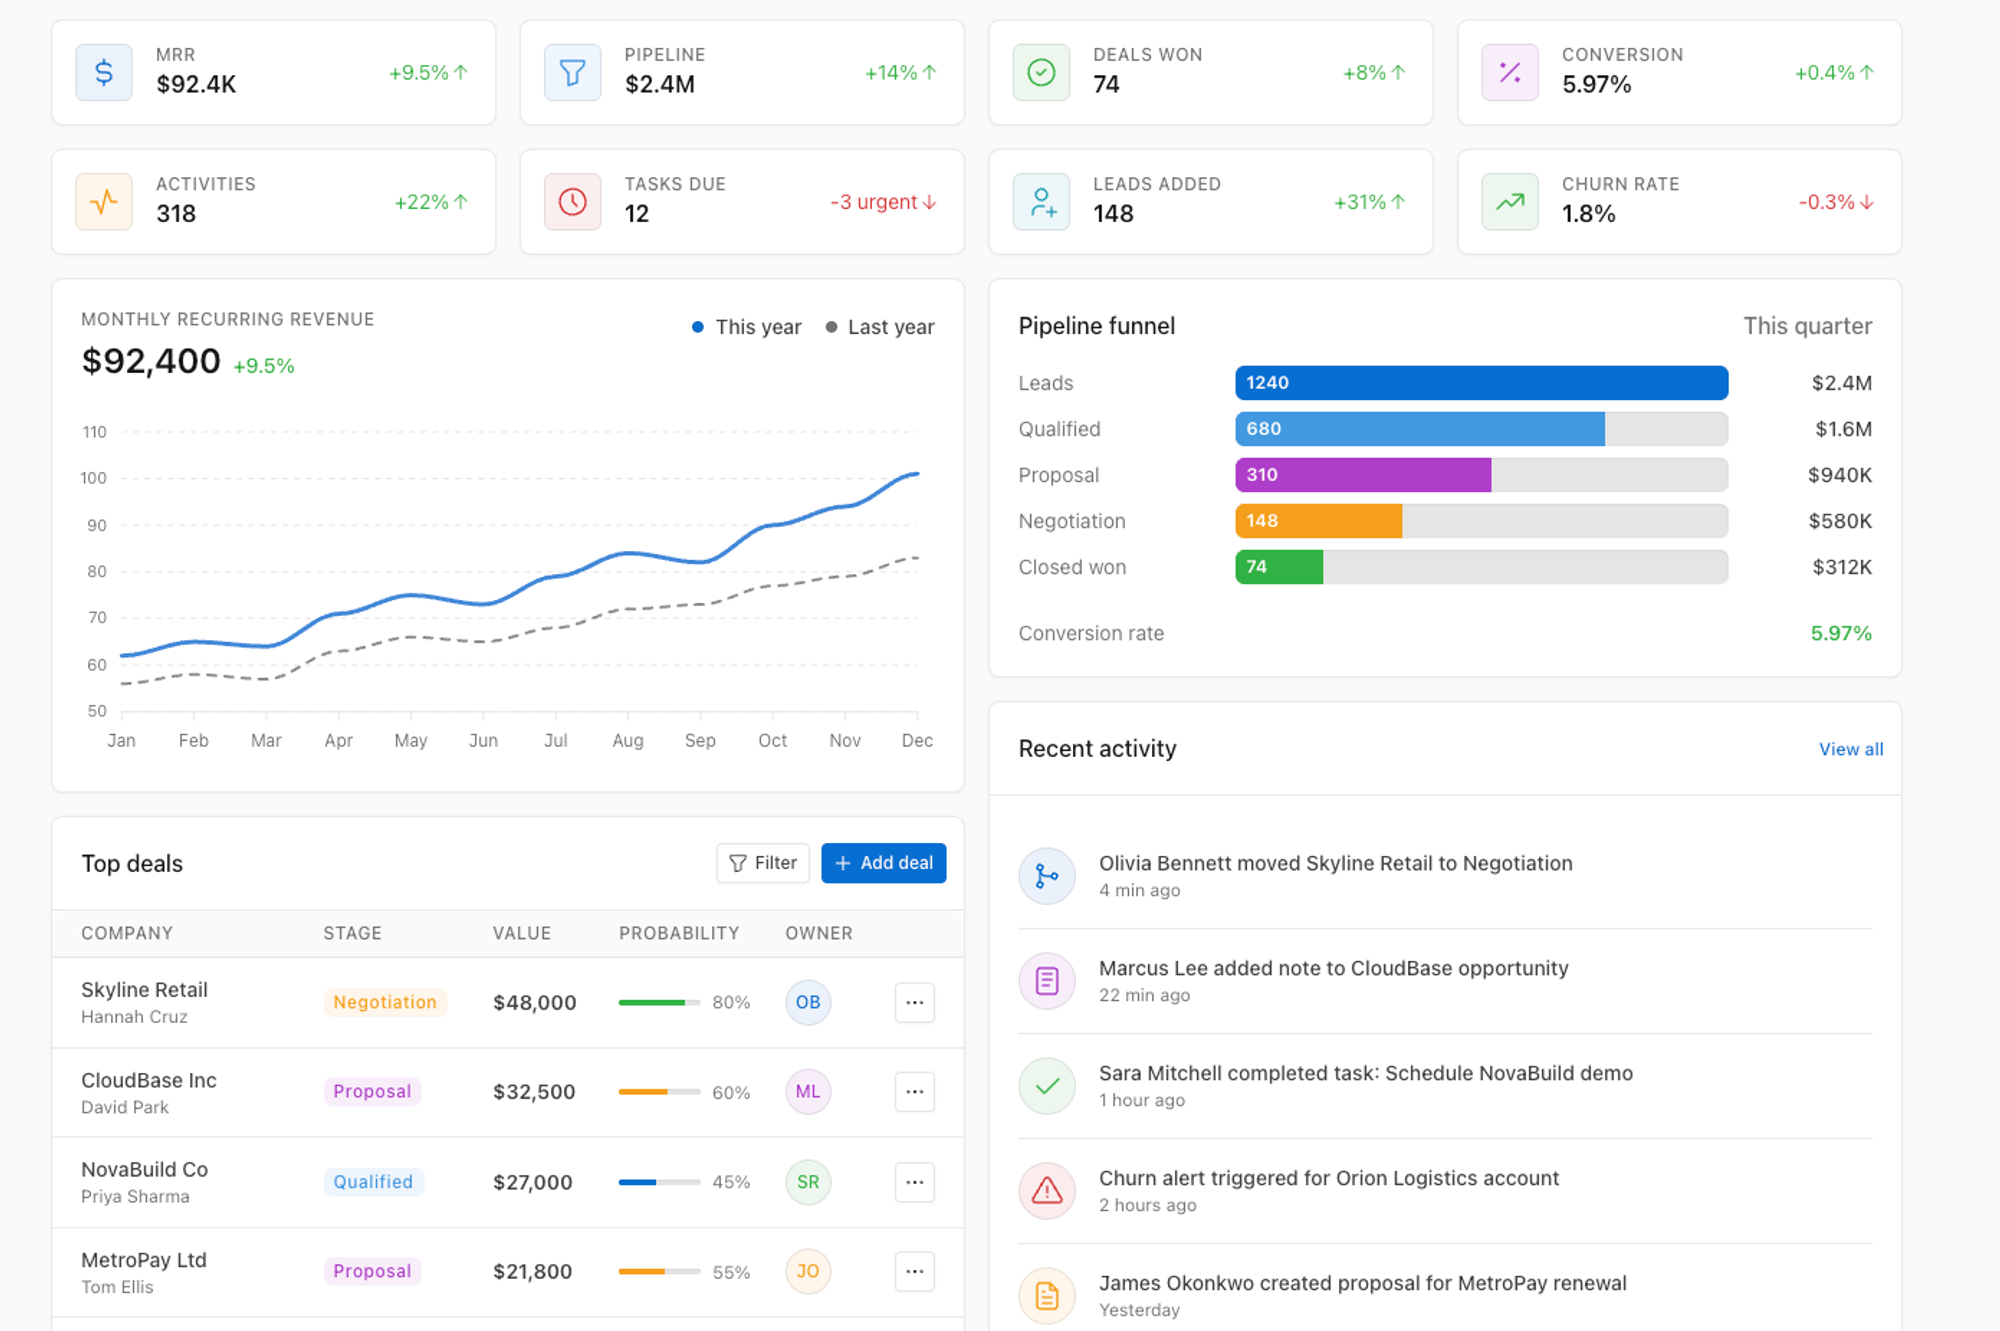
- They see clean charts, totals and trends, always live, never the raw spreadsheet.
- Everyone else gets a polite "you don't have access".
To the client it feels like an app: their logo, their domain, an icon on the phone's home screen. For you it's mostly a well-designed web page plus some smart wiring.
How it works (without the jargon)
The setup has four building blocks, all from providers your clients already trust:
- Google Sheets: where the data lives. Nothing changes for the people entering data. The sheet stays private and is never shared publicly.
- Google Apps Script: a small reader attached to the sheet. It reads the relevant tabs and hands the numbers over, but only to a caller that presents a secret key.
- A Cloudflare Worker: the dashboard itself. It serves the dashboard page on the client's domain and fetches the numbers from Google behind the scenes. The browser never talks to Google directly, so there are no Google links, banners or sharing settings to worry about.
- Cloudflare Access: the front door. Before anyone reaches the dashboard, Cloudflare asks them to sign in with Google and checks their email against an allow-list. Adding or removing a team member is one line in a settings screen.
The key design choice: the spreadsheet is never exposed. People get access to the dashboard, not to the data source. Access is checked twice, at the front door (the login) and between the dashboard and the sheet (the secret key).
Why clients like it
- No new tool to learn. The team keeps using the spreadsheet they know. The dashboard is a bonus, not a replacement.
- Live numbers. No exports, no weekly PDF, no "which version is this?". Refresh the page and it's current.
- Their brand, their domain. It looks like part of the company, not a third-party tool with someone else's logo.
- Works on every phone. It's a normal website, so it opens on any device, and can be added to the home screen like an app.
- Simple, secure access. No passwords to hand out or reset: people sign in with the Google account they already have, including its 2-step verification. Removing access when someone leaves takes seconds.
- The data stays theirs. The numbers remain in their Google account and access control in their own Cloudflare account. No dashboard vendor stores a copy.
Why it's interesting for agencies
- A natural upsell. You already manage the client's domain, website and often their Cloudflare account. A private dashboard is a small, high-value addition to the relationship.
- Low cost for the client. For small teams, the services involved fit inside free plans (more on that below), so you sell your work, not someone else's licence.
- Plays to your strengths. The hard part isn't the plumbing, it's designing a dashboard people actually understand: the right numbers, clear charts, a good mobile layout. That's design work.
- Reusable. Once you've built it once, the same architecture works for the next client. Only the spreadsheet layout and the charts change.
- Recurring value. New views, new metrics, a new year's tab: there's always a reason to come back.
Example projects:
- a monthly revenue and average-income dashboard for a small agency or freelancer,
- a sales pipeline overview for a 10-person sales team,
- project hours vs. budget for a studio,
- bookings and occupancy for a hospitality client,
- a KPI page for a client's management team, on
kpi.clientdomain.com.
What does it cost?
The software side is free for small teams, as long as usage stays within the providers' free plans:
Building blockFree allowance (at the time of writing)Cloudflare Access (the login)free plan for up to 50 usersCloudflare Workers (the dashboard)a generous daily request allowance on the free planGoogle Sheets + Apps Scriptincluded with a Google account, within daily quotasGoogle sign-in setupfreeDomain namethe one real cost, and most clients already own one
Free plans and limits are set by Cloudflare and Google and can change, so check the current terms for each project. For a typical small team viewing a dashboard a few times a day, they're more than enough.
Be honest about the limits
This isn't a replacement for a full BI platform, and it's worth telling clients so upfront:
- Setup needs a developer. It's quick to maintain afterwards, but the first setup involves Cloudflare, Google and a few technical steps. That's your job, not the client's.
- One view for everyone. Everyone who's invited sees the same dashboard. "Each salesperson sees only their own numbers" is possible, but it's extra development.
- Read-only. People view data in the dashboard and edit it in the spreadsheet.
- The spreadsheet's structure matters. If someone renames the rows or tabs the dashboard relies on, it needs a quick fix. Agree on a "don't touch" area of the sheet.
- Spreadsheets aren't databases. Perfect for hundreds or a few thousand rows; not for millions of records or heavy multi-user data entry.
- A second or two to load. The dashboard reads the sheet live on every visit; a short branded loading screen makes this feel intentional.
- No uptime guarantee on free plans. If a provider has an outage, the dashboard waits with it. That's fine for internal dashboards, but not for anything mission-critical.
When it's a great fit, and when it isn't
A great fit when:
- the client already lives in Google Sheets,
- a small group (roughly 1–50 people) needs to see the numbers,
- they want something that looks professional and lives on their own domain,
- the budget doesn't stretch to a BI tool.
Not the right tool when:
- the data comes from many systems and needs heavy processing,
- different people must see different data with strict rules,
- the dashboard is customer-facing at scale, or needs guaranteed uptime.
The takeaway
Your clients' most valuable data often sits in a spreadsheet nobody enjoys looking at. With a few free building blocks and your design skills, you can turn it into a private, branded dashboard app: live, mobile-friendly, and visible only to the people they choose.
It's a small project with a big "wow", and a natural next step for any agency that already looks after a client's website and domain.
Want to see it in action or explore it for one of your clients? Get in touch.